
SWYM projects
SWYM / COMMERCE ANALYTICSProduction experience

Inventory Analytics: Turning Stockouts into Revenue Signals

A Streamlit dashboard that makes potential revenue loss from inventory issues easier to investigate.

PythonStreamlitAnalytics
SYSTEM OVERVIEW
the pieces, connected.
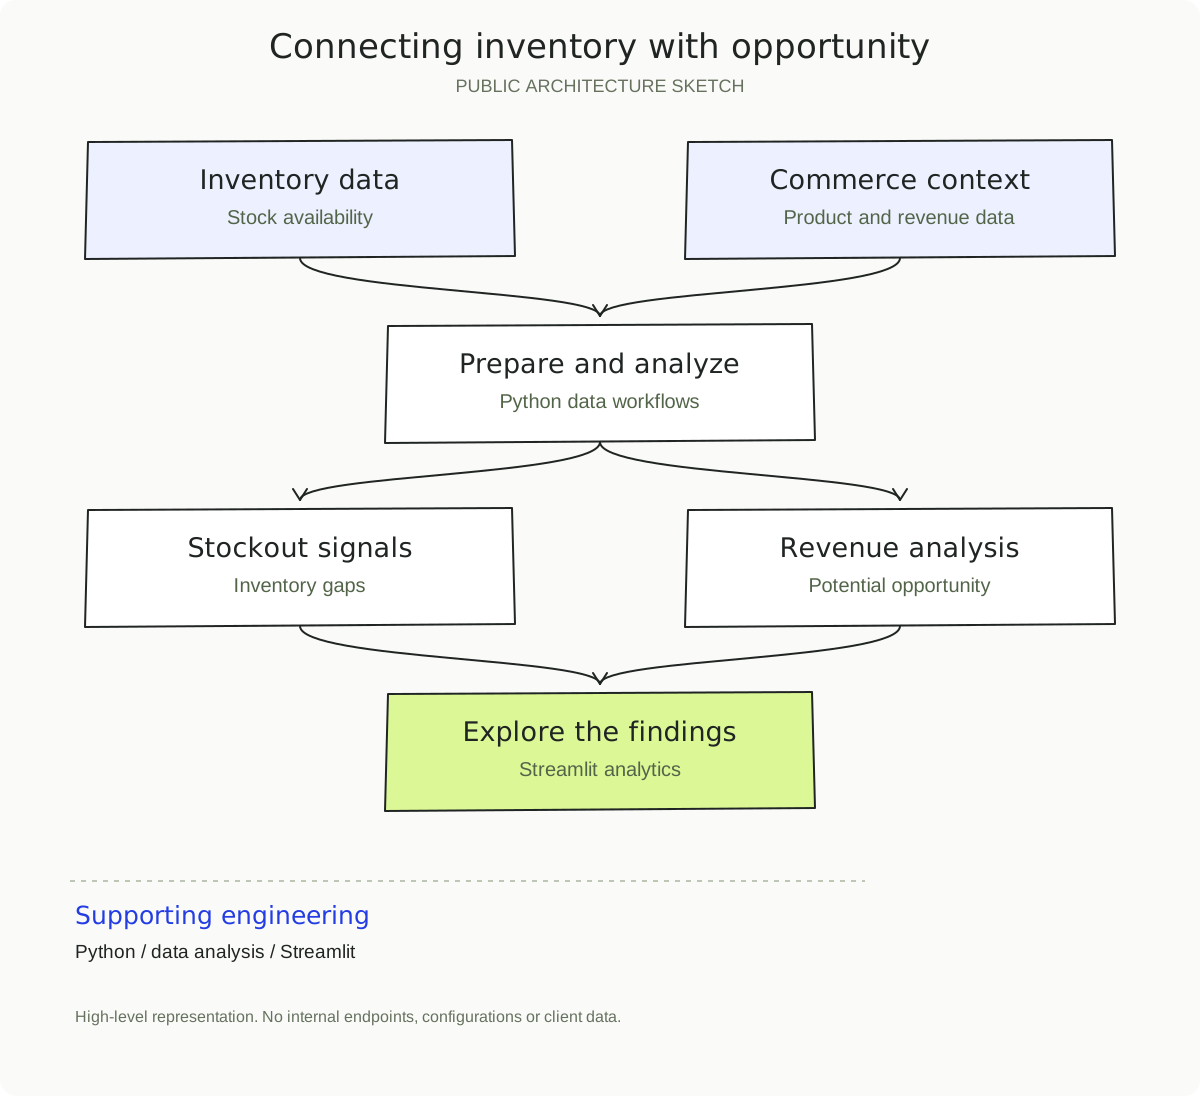
Inventory data (Stock availability) + Commerce context (Product and revenue data) → Prepare and analyze (Python data workflows) → Stockout signals (Inventory gaps) + Revenue analysis (Potential opportunity) → Explore the findings (Streamlit analytics)

A public sketch of the documented components and workflow. Internal interfaces are omitted.

Download full-resolution SVG
THE PROBLEM

Where the work started.

Stock-outs can hide commercial opportunities. Teams need a clear view of where inventory availability may be affecting revenue.

MY CONTRIBUTION

What I built.

  • Built a Streamlit analytics dashboard for investigating inventory-related revenue opportunities.
  • Used Python to translate stock-out analysis into a dashboard that stakeholders could explore.
THE RESULT

Made potential stock-out-related revenue loss visible through an analytics dashboard.

Selected work from my engineering role at SWYM.

CODE & EVALUATION

Inspect the work behind the explanation.

SYNTHETIC COMPANION EXAMPLE

Absolute and squared error for numeric estimates

A new, runnable example that scores saved predictions against expected outputs. It uses fictional data and illustrates evaluation mechanics; it does not reproduce the production system or substantiate the impact figures above.

python3 evaluate_outputs.py inventory.json report.json

Python 3.10+ · Standard library only · Includes fixtures, metric definitions and tests

Explore more projects Discuss this project